DepthReading
Mapping the past
When the Nebra Sky Disc was buried, it had already been in use for 200 years. While its raw materials were imported from as far away as Cornwall, the knowledge required to create the object was entirely local, drawn from observing the heavens from atop Mittelberg, a mountain near the modern village of Nebra. The bronze disc—the world’s oldest representation of a specific astronomical phenomenon—had five phases over its history. In the first phase, the disc showed the night sky with 32 gold stars, including the Pleiades, a gold orb representing the sun or a full moon, and a crescent moon. It served as a reminder of when it was necessary to synchronize the lunar and solar years by inserting a leap month. This phenomenon occurred when the three-and-a-half-day-old moon—the crescent moon on the disc—was visible at the same time as the Pleiades. “The astronomical rules that are depicted wouldn’t be imaginable without decades of intensive observation,” says Harald Meller, director of the State Museum for Prehistory in Halle. “Until the Sky Disc was discovered, no one thought prehistoric people capable of such precise astronomical knowledge.”
Artisans next added two golden arcs to the sides of the disc, hiding two original stars. The arcs, one of which was later removed, show the horizons as seen from Mittelberg on the summer and winter solstices. At some unknown time, a stylized ship was affixed at the bottom as an allegorical symbol of the sun’s journey across the sky. “One of the most fascinating aspects of the Sky Disc is that its first two phases show the results of pure observation, astronomical knowledge without any religious or mythological implications,” says Meller. “It’s only in the third phase that these aspects, represented by the ship, are added.” Next, holes were bored around the disc’s edge, probably to attach it to a pole to be carried as a standard. Finally, in around 1600 B.C., the disc, perhaps no longer of either scientific or religious use, was buried, likely as an offering to the gods.
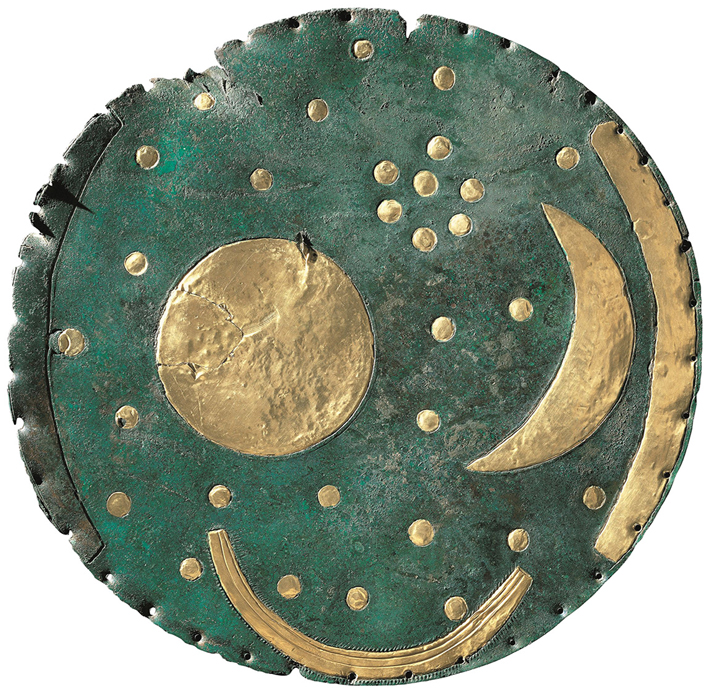
THE NEBRA SKY DISC. DATE: ca. 1800 B.C. MATERIAL: Bronze and gold. DIMENSIONS: 1 foot diameter, weight 4.6 pounds. FOUND: Saxony-Anhalt, Germany.
Nippur Map Tablet
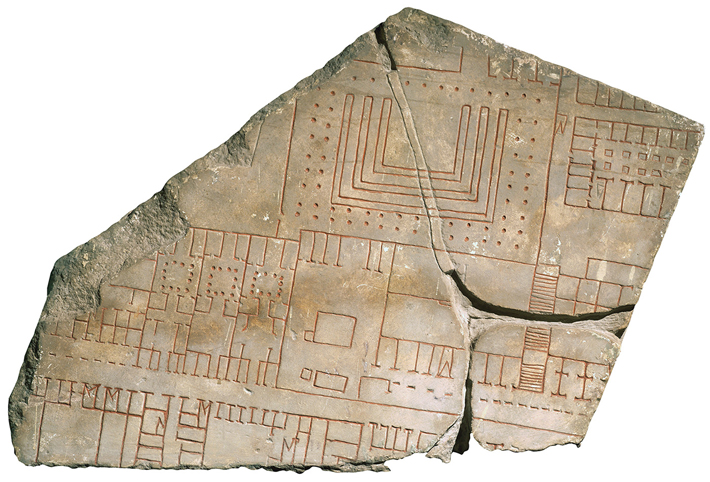
For the busy farmers of the Babylonian sacred city of Nippur, ready access to water was essential. It’s hardly surprising, then, that this tablet, which maps an area near the city, features a complex irrigation network of ditches and canals, depicted by lines, along with a number of towns and agricultural estates, represented by circles. What is somewhat surprising, though, is that a map of the area was produced at all. Landholdings in Mesopotamia were typically described rather than drawn, explains Philip Jones, a curator at the Penn Museum. “It’s difficult to put your finger on why this map was created,” he says, “but it must have been for some administrative purpose.”
The map’s central section, identified in cuneiform writing as a “field of the palace,” suggests that the tablet served as a guide to estates belonging to the recently established Kassite Dynasty, which was based in the city of Babylon, around 70 miles northwest of Nippur. At this time, the region’s new Kassite rulers were challenging the religious establishment in Nippur, which had long been the seat of the chief Sumerian god, Enlil. The top center section of the tablet includes an estate and field of Marduk, the patron god of Babylon. Says Jones, “What we see here is that Marduk is beginning to usurp Enlil’s place and is actually getting land within Enlil’s own city.”
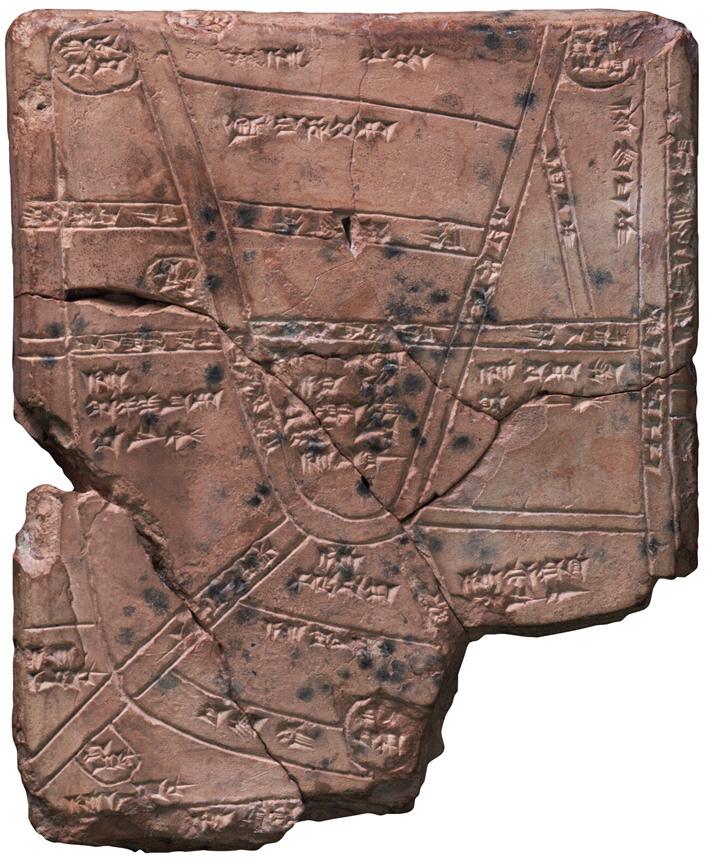
NIPPUR MAP TABLET. DATE: ca. 1500 B.C. MATERIAL: Clay. DIMENSIONS: 5 inches by 4.3 inches. FOUND: Nippur, Iraq.
The Goldmine Papyrus
The world’s oldest known geological map is a nine-foot-long papyrus from the Egyptian village of Deir el-Medina, home to the New Kingdom craftsmen who worked in the Valley of the Kings. Created by Amennakhte, the chief scribe of the royal necropolis, the papyrus depicts a dry riverbed called the Wadi Hammamat in Egypt’s eastern desert. The wadi had been used for quarrying and mining for centuries, and as a route connecting the Nile Valley to the Red Sea for millennia. No map would have been needed for general travel, according to Egyptologist Andreas Dorn of Uppsala University and linguist Stéphane Polis of the University of Liège. Instead, the papyrus was created as a commemorative record of a pharaonic expedition, perhaps during the reign of Ramesses IV (r. ca. 1153–1147 B.C.), to a bekhen-stone quarry. Bekhen-stone, or greywacke, was prized for use in high-quality sculptures. To distinguish types of stone, Amennakhte employed dark brown to represent bekhen-stone, pink for deposits of granite and gold, and spots for alluvial deposits.
The scribe also included quarried bekhen-stone blocks with their measurements, as well as roads and directions in hieroglyphs, such as “road leading to the sea.” Amennakhte also drew natural and built landmarks including small trees, bushes, and a well, along with a monument to Seti I (r. ca. 1294–1279 B.C.) and a temple to the god Amun, both illustrated in white at the far left. “Amennakhte definitely had experience visualizing complex structures, as he was also responsible for drawing tombs. He was able to represent topographical information by flattening out such things as roads and the natural environment,” says Polis. “This unique document mixes geographical and geological information in a way that anticipates many of our modern mapmaking practices.”
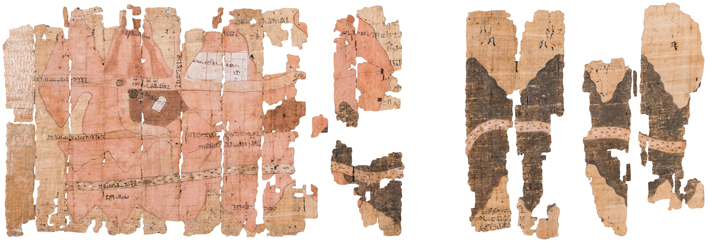
THE GOLDMINE PAPYRUS. DATE: ca. 1151–1145 B.C. MATERIAL: Papyrus. Dimensions: 9 feet by 1.3 feet. FOUND: Deir el-Medina, Egypt.
Han Dynasty Map
In 168 B.C., a lacquer box containing three maps drawn on silk was placed in the tomb of a Han Dynasty general at the site of Mawangdui in southeastern China’s Hunan Province. The general was most likely the son of Li Cang, the ruler of the Changsha Kingdom—a fiefdom of the Han Empire—whose own well-appointed tomb lay nearby.
Each map presents a section of the Changsha Kingdom. One map, now largely in tatters and difficult to read, seems to show a city or mausoleum. Another focuses on the locations of military garrisons in a region that lay near Changsha’s frontier with a fractious neighboring kingdom. The third map, shown here, illustrates the mountains, rivers, and important settlements of the southern half of Changsha.
The Mawangdui maps demonstrate a high degree of standardization, especially in their use of abstract signs, such as squares to symbolize cities, says Cordell Yee, a cartographic historian at St. John’s College in Annapolis. He points out that the maps are so sophisticated that they were likely produced according to long-established cartographic traditions. “This suggests mapmaking was already well developed in China by this time,” says Yee. The maps were undoubtedly indispensable for administrative and military planning purposes, but they may also have been enjoyed as works of art. Next to depictions of a prominent mountain range, the Jiuyi Shan, or Nine Beguiling Mountains, the dark area at the far left, the mapmaker carefully drew in shadowy images that may depict the reflection of the peaks in a nearby lake.
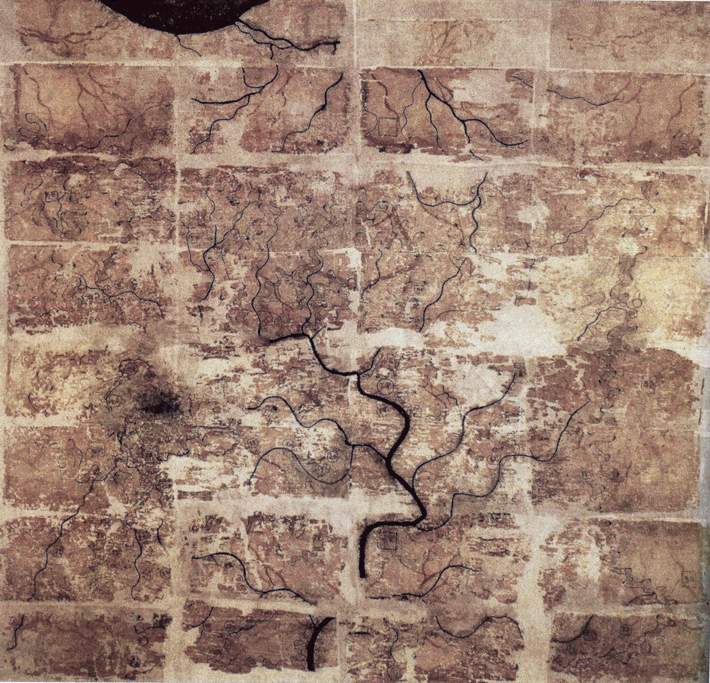
HAN DYNASTY TOPOGRAPHIC MAP. DATE: Before 168 B.C. MATERIAL: Ink on silk. DIMENSIONS: 3 feet by 3 feet. FOUND: Hunan, China.
The Forma Urbis Romae
The Forma Urbis Romae, or map of the city of Rome, was a massive plan of the layout of the city under the emperor Septimius Severus (r. A.D. 193–211). Although only a small portion of the plan survives, scholars are relatively certain it illustrated most of the city. This fragment shows commercial structures on the southeastern slope of the Viminal Hill. The Forma Urbis adorned the wall of a room in Rome’s Temple of Peace that might have served as an archive of maps and records. Drawn at a scale of 1:240, the plan resembles a land surveying map, in that it includes not only streets and blocks, but also interior features of buildings, such as colonnades and staircases. However, its monumental size—60 feet by 43 feet—suggests a decorative rather than practical function, says archaeologist Susann Lusnia of Tulane University. “The Forma Urbis provided an overview of the changes made to Rome by Severus in his quest for legitimacy and establishment of his dynastic succession,” she says. “The marble plan was itself a monument to the Severan legacy in Rome.” Severus’ ambitious building program included both restoration of older monuments and creation of new ones as part of his effort to draw attention to his nascent dynasty.
FRAGMENT OF THE FORMA URBIS ROMAE. DATE: A.D. 203–211. MATERIAL: Marble, DIMENSIONS: 26 inches by 23.6 inches. FOUND: Rome, Italy.
The Paracas Textile
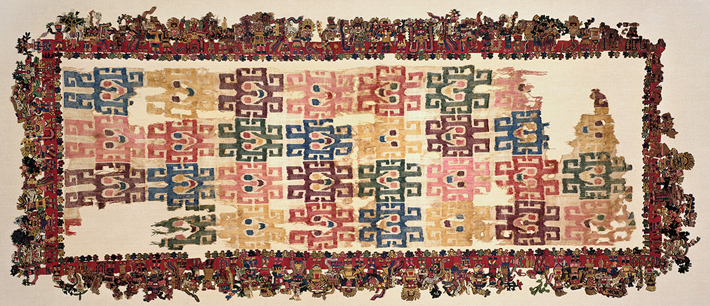
THE PARACAS TEXTILE. DATE: A.D. 100–300. MATERIAL: Cotton and camelid fiber. DIMENSIONS: 2 feet by 4.9 feet. FOUND: Paracas, Peru.
The mantle might also be seen as a map representing the Andean concept of cyclical time, according to geographer William Gartner of the University of Wisconsin–Madison. The figures on the textile’s border illustrate the movement of people around a village plaza. With the cloth wrapped around his or her head, says Gartner, the deceased individual would have been able to join in this symbolic procession, which carries on in perpetuity.
Catawba Map

CATAWBA MAP. DATE: ca. 1721. Material: Paper. DIMENSIONS: 3.5 feet by 2.5 feet. FOUND: Charleston, South Carolina.
Soon after arriving in Charleston, Francis Nicholson, the newly installed royal governor of South Carolina, received a deerskin map thought to have been drawn by an Indian “cacique,” or chief. Nicholson ordered a paper copy of the map, which represents 13 native groups as circles connected with lines. It remains a rare example of indigenous North American cartography from the colonial period.
Archaeologist Gregory Waselkov of the University of South Alabama believes that the mapmaker was probably a member of the Catawba people—who still call South Carolina home—as the Catawba community of Nasaw occupies the central position. European settlements, including Charleston and Virginia, are portrayed by squares, which Waselkov thinks was not only a way of differentiating the English as foreigners, but may have constituted a native critique of European rigidity. The circles and squares vary in size, likely in proportion to the importance accorded the communities by the mapmaker. The connecting lines illustrate social and political relationships among people throughout the South Carolina Piedmont and the greater Southeast. “Archaeologists are often reluctant to make assumptions about peoples’ knowledge of their neighbors without the presence of artifacts,” Waselkov says. “But this map is further evidence that native people were aware of things far from their own hearths.”
Wooden Inuit Maps
In 1885, an Inuit hunter named Kunit traded a trio of unusual wooden maps to Gustav Holm, the leader of a Danish expedition that was making its way up Greenland’s east coast. The maps served as a guide to a stretch of coast north of Ammassalik, the small settlement where the transaction took place. Two of the maps, shown here, complement each other: One map, left, portrays the undulating coastline, with alternating fingers of land and fjords, and the other represents a string of offshore islands. The third depicts a peninsula.
The maps were not designed for practical navigational use, says archaeologist Hans Harmsen, a curator at the Greenland National Museum, but rather as storytelling aids. “You could show the person who was hearing the story the contours of the coast and the relationship between the islands and the coastline,” he says. The map of the coast even includes a pronounced arcing groove indicating where a traveler would have to carry their kayak overland to get to the next fjord. There is no evidence that such wooden maps were commonly produced by the Greenland Inuit, as those Kunit made for Holm are the only ones of their kind known.
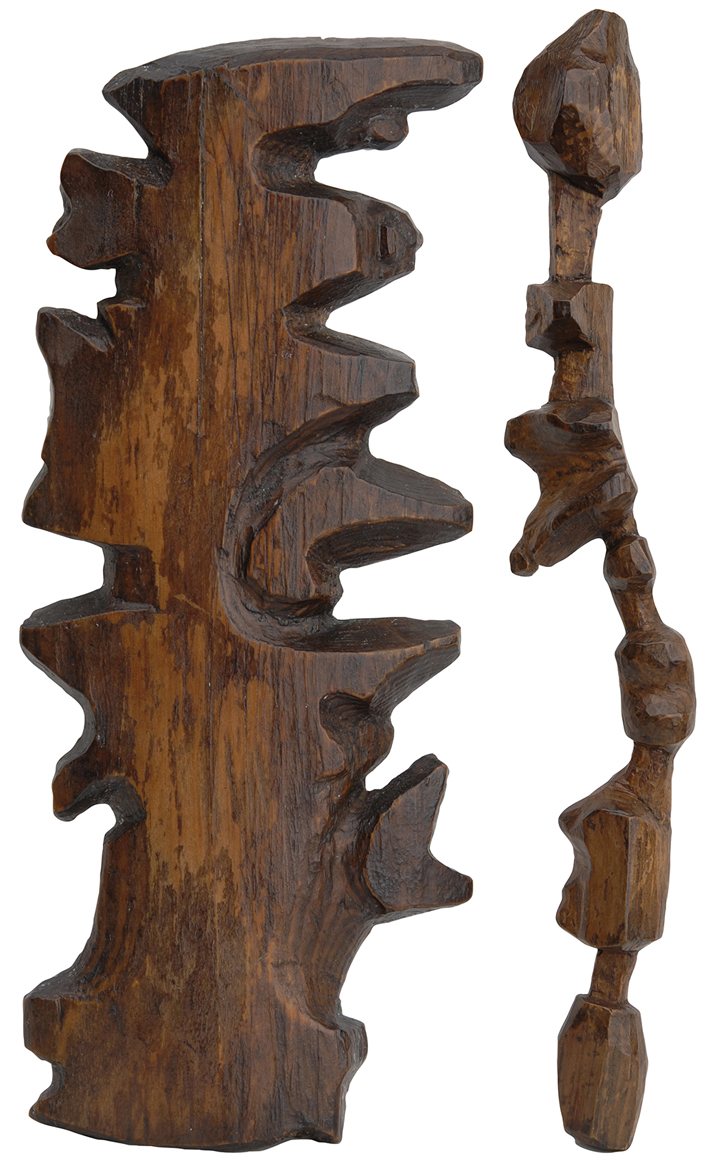
WOODEN INUIT MAPS. DATE: 1885. MATERIAL: Wood. DIMENSIONS: 5.5 inches by 2 inches (left), 8.5 inches by 1 inch (right). FOUND: Ammassalik, Greenland.
Marshall Islands Stick Chart
The education of a navigator in the Marshall Islands, a Micronesian archipelago in the South Pacific, traditionally began by being blindfolded in a canoe. Young sailors learned to feel and intuit the motion of the sea before ever venturing out on ocean journeys. The deep Marshallese connection with waves and their movements reaches back more than 2,000 years to land-finding techniques used by the islands’ first settlers.
Scholars have identified two different types of Marshall Islands stick charts, wooden diagrams the Marshallese have been producing since at least the middle of the nineteenth century. The first and probably older type, shown here, contains abstract representations of how waves interact with bodies of land in general. The second type illustrates actual islands, often represented by cowrie shells, along with swell patterns identified and recorded by pilots. “There aren’t that many examples from across the Pacific of this kind of navigational knowledge being encoded or physically represented,” says anthropologist Joseph Genz of the University of Hawaii. He says the charts were used mainly as teaching devices rather than real-time way-finders. They help to impart perhaps the most crucial concept in the Marshallese navigational tradition, that of the dilep, or “backbone wave.” “People still describe the dilep as the most important wave to find,” Genz says. “It’s like a path you can follow to the next atoll. Instead of going landmark to landmark, you go seamark to seamark.”
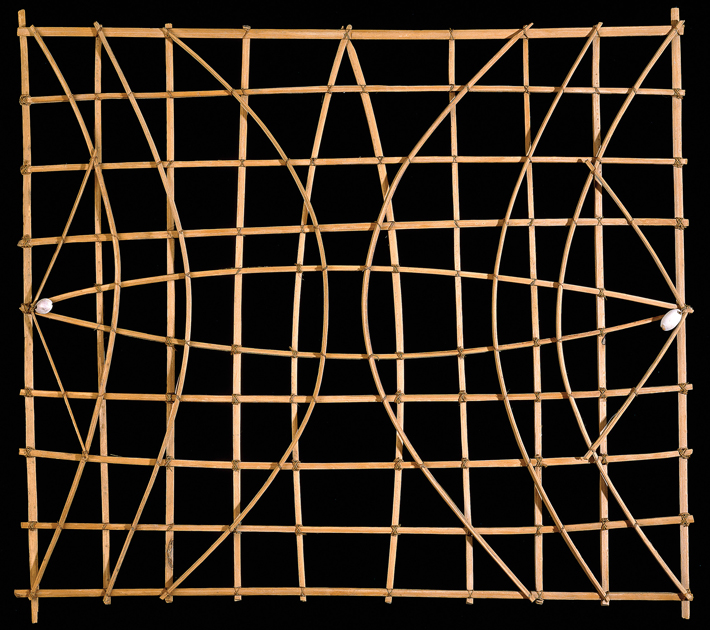
MARSHALL ISLANDS STICK CHART. DATE: ca. late 19th to early 20th centuries. MATERIAL: Wood and cowrie shell. DIMENSIONS: 2 feet by 1.8 feet. FOUND: Marshall Islands, Micronesia.
Category: English
DepthReading
Key words: